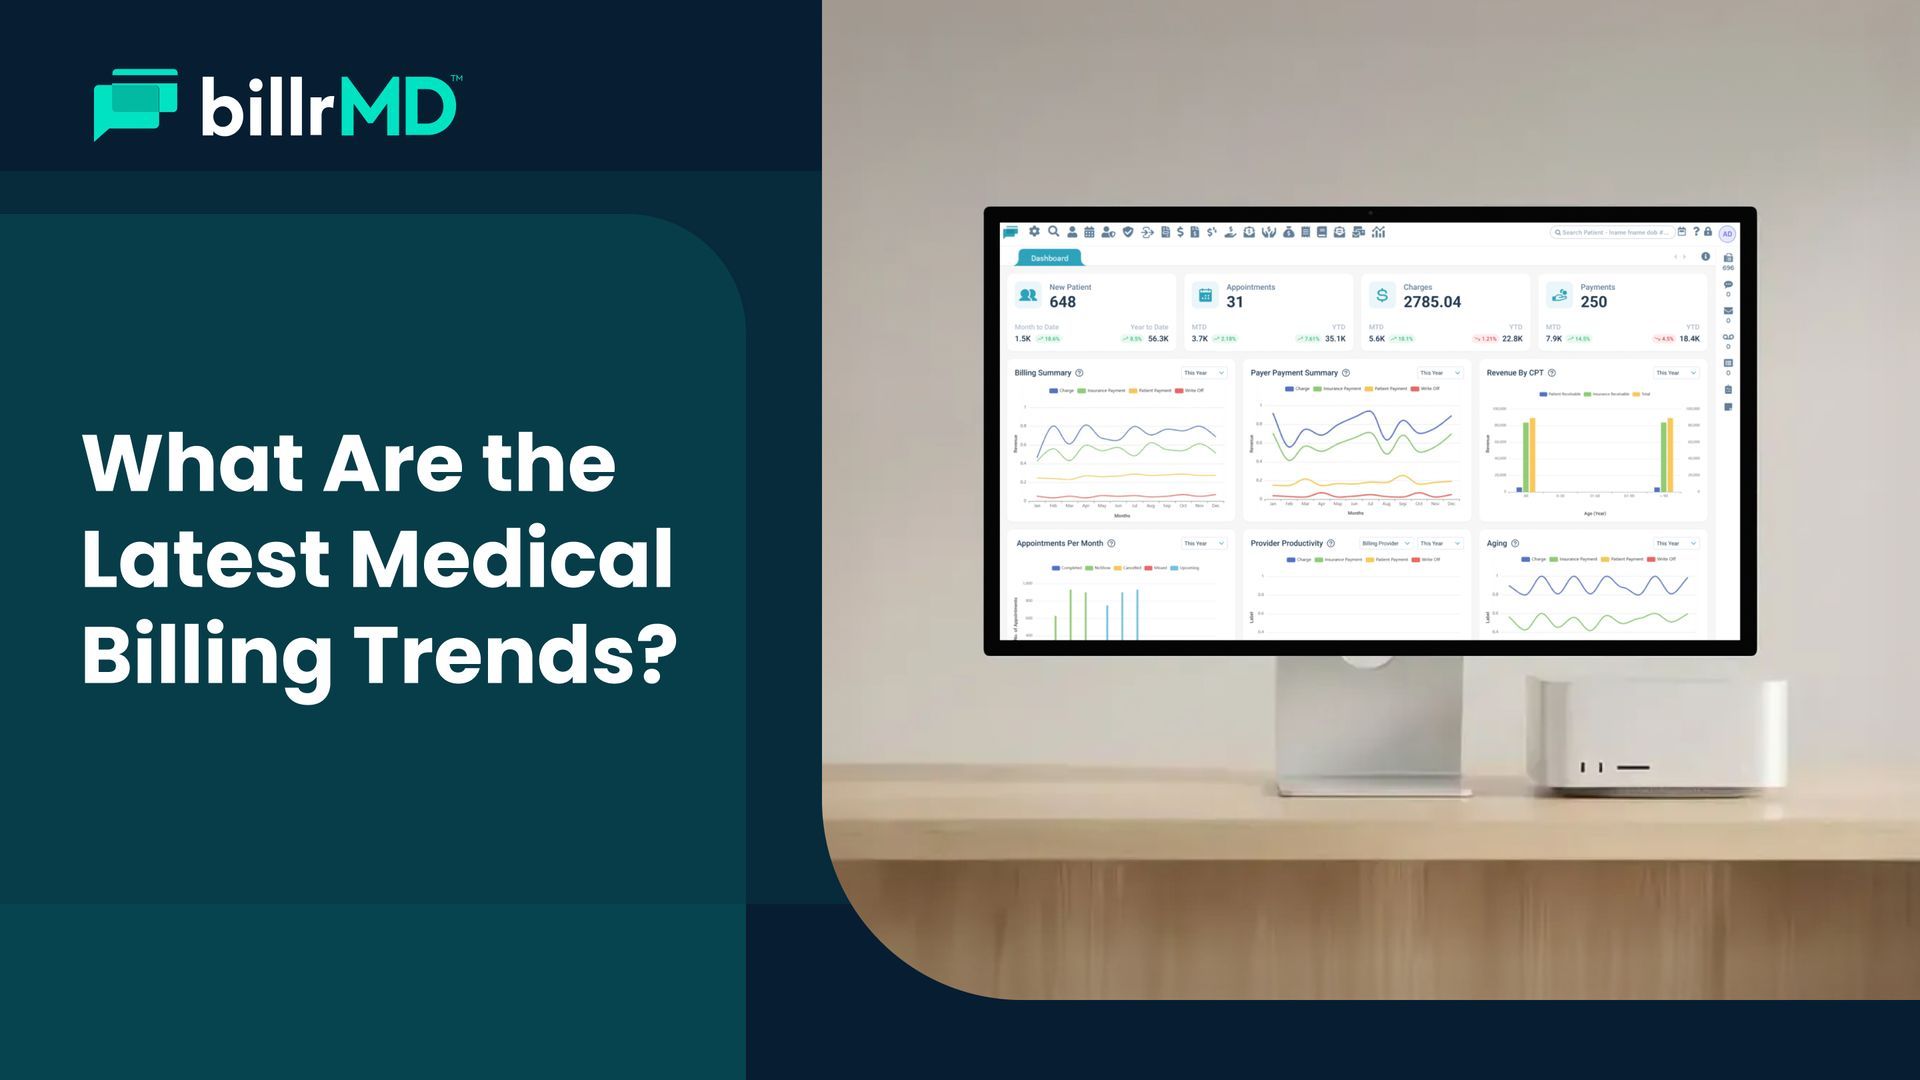
How to Maximize Your Free Practice Analytics Software
In a world inundated with statistics and trends, data serves as a compass that guides businesses towards success—and healthcare practices are no exception. However, unlike other industries that generate a tremendous amount of data, many healthcare organizations still struggle to convert cold, hard numbers into useful insights to improve patient care, operational efficiency, and revenue.
The Role of Data Analytics in Healthcare

In its raw form, data doesn’t offer as much value as when it is refined. That’s where cutting-edge solutions, like billrMD, enter the picture. As a free practice analytics software, billrMD’s reports and data analytics tools give you a clear picture of your practice’s operational and financial performance, allowing you to pinpoint areas for improvement and make strategic adjustments.
As a web-based practice management and medical billing software, billrMD allows you to tackle your administrative and billing workflows in one platform, freeing you from the hassle of maintaining multiple systems while saving time and money.
The role of data analytics in healthcare encompasses every aspect of your practice, from the clinical side of things to operations and financial management. Today’s volatile economy amplifies the adverse consequences of poor decision-making; one small mistake can leave a gaping hole in your workflows, care delivery capabilities, and bottom line.
Your Entire Cash Flow in One Dashboard
Staring at a screen with nothing but endless rows of numbers can be overwhelming. One of the biggest challenges in healthcare data analytics is turning vast amounts of data into intuitive, easy-to-understand graphs. Even then, the process of visualizing data is time and labor intensive.
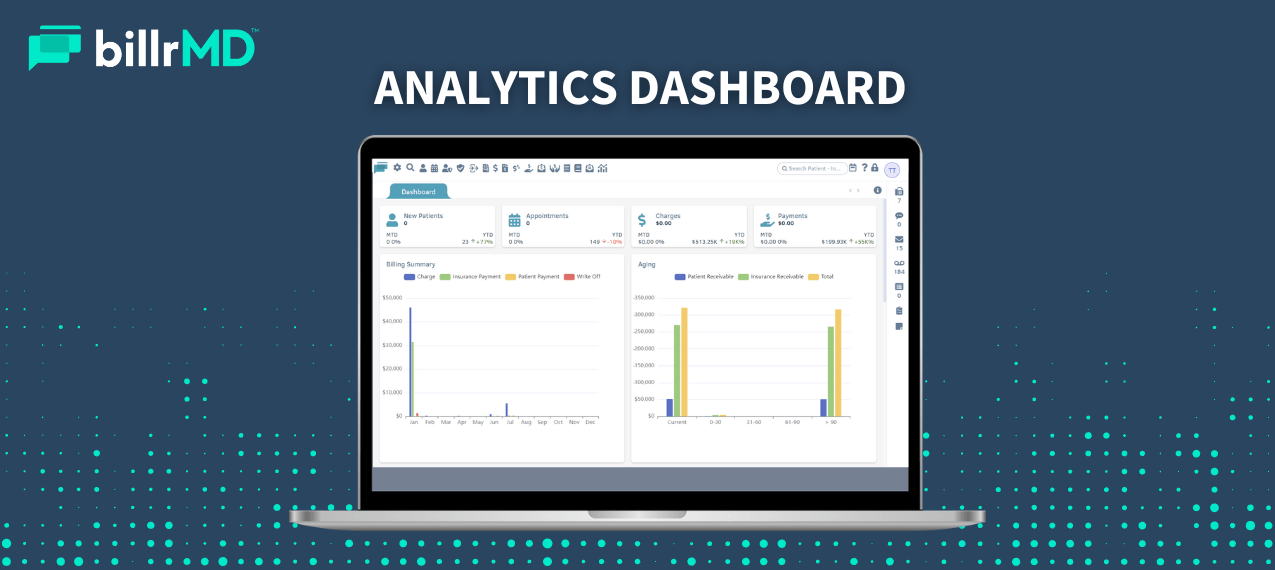
Sophisticated practice analytics platforms save you from all the work. billrMD consolidates all data from every area of your practice into one comprehensive dashboard, providing a high-level overview of your operational and financial performance.
Billing Summary
See all charges and payments, including write-offs, in the billing summary chart. Broken down into charges, insurance and patient payments, and write-offs, the billing summary chart gives you a month-to-month view of your total billed amount, the total payments received, and where the payments came from.
Seeing your monthly charges against your monthly collection instantly lets you know whether or not you’re meeting your revenue targets.
Claims Aging
Also known as account receivables or A/R, claims aging refers to the period of time claims have been in receivables. In other words, the number of days a claim has remained unpaid. Usually, claims take an average of one month to get paid.
billrMD’s Claims Aging graph shows you the total receivable amount, the insurances’ and patients’ share, and the claims’ age in a 30-to-90-day range. This keeps you up to speed with the payments you are yet to collect and allows you to follow up on the claims that have been sitting on A/R for quite some time.
Provider Productivity
Especially for practices with multiple offices, specialties, and providers, seeing individual performances puts the overall practice performance into perspective. That’s why the billrMD Dashboard comes with a Provider Productivity report showing which office location, specialty, or provider drives the most revenue. The graph also lets you view productivity statuses by day, month, or year.
Seeing individual performance data allows you to
make strategic adjustments on your practice’s overall productivity.
Appointments Per Month
The number of appointments your practice takes will vary from month to month. During the flu season, for example, you’ll naturally see fewer vacant slots on your schedule. Knowing which months perform better than others will allow you to refocus your sales and marketing efforts.
The monthly appointment graph in the billrMD Dashboard shows you the total number of booked appointments per month, including the completed visits, no-shows, cancellations, and missed and upcoming appointments.
Revenue By CPT Code
The current procedural terminology (CPT) code is the global standard coding language for billing or reporting medical services and procedures. The Revenue by CPT Code graph shows you the daily, monthly, and yearly revenue of the CPT codes of each service or procedure you offer.
The advantages of knowing which CPT codes drive the most revenue is immense. It makes it easier to decide which services to invest in and allows you to recalibrate your marketing campaigns around your most profitable services, positioning you as a trusted expert in that niche.
Payer Payment Summary
Tracking your payment collection shouldn’t just end with the total amount received. It’s equally essential to track where the payments are coming from.
The billrMD Dashboard comes with a payer payment summary that lets you see the total amount you’ve collected from every insurance. This helps decide which insurance companies to accept.
Data-Driven Decisions in a Click

As a provider or practice owner, every move you make has far-reaching consequences. They have implications for your business, employees, and patients.
With so much riding on your decisions, it only makes sense to anchor them on accurate and current data. Technology has made capturing and gathering data easier; the challenge now lies in making the numbers make sense.
As a free practice analytics software, billrMD works to turn complex data into actionable insights. With the Dashboard and data analytics features, billrMD brings smarter decisions just a click away.
Recent Posts